Posts

Showing posts from 2020

2021 Outlook Review

As 2020 comes to a close, a new year in 2021 demands our attention. The top institutions have released their takes on what the next year will look like financially as one of the most dramatic years comes to a close. Global economic and financial outlooks have the tough task of reviewing the cornucopia of troubling events from 2020 while looking forward to what 2021 could bring. Some central themes can be picked out in the following annual outlooks but also key differences. In the decisions of what to keep in and out of the report, we can see what is expected to be the driving economic forces in the new year. Vanguard Wells Fargo BlackRock Lazard Merrill Lynch JPMorgan Citi The two themes most dominant in all the outlooks were the easing of COVID-19 and a continuation of easing in central banking policy. Every report saw these as driving forces in 2021 as they were in 2020, and of course, it's no secret that these would be chosen to guide the discussions. More specifically, COVID-19...

When Tech Diverges...

Image
The stock market has been on a tear. Despite a global pandemic reemerging in the second half of the year, investors seem to be okay with buying on expectations of an improvement in the economy in 2021 because that seems to be the only real reason for bulls to win out in the market. Unemployment is still at excessive levels with more than 700,000 claims for unemployment being filed every week (though continued claims are slowly edging lower). The bounce in output growth was strong over the summer but momentum seems to be slowing in retail sales, manufacturing, and industrial output. Despite this, indexes reach all-time highs. That is even more so true for the Nasdaq which has rocketed past its pre-pandemic highs. The index tracking the top tech companies seems to have left the S&P 500 and the Dow Jones Industrial Average in the dust. Based on trading from February 24th to November 27th, the Dow and the S&P 500 have grown 6.97% and 12.79% while the Nasdaq has surged 32.37%. Some ...

Health Insurance Data: 2019 Update

Image
In the upcoming election season, Democrats and Republicans will continue to go head to head over various hot button topics as they jostle for control of the White House and Congress. Healthcare will be one of those topics primed for debate amongst candidates as discussions over "Medicare for All" continue to take center stage. In those debates, potential voters will hear the latest data rattled off as candidates look to bolster their talking points. Those data points will likely come from the Census Bureau's latest edition of the "Health Insurance Coverage in the United States" report which highlights their 2019 findings. Here are some highlights.  The number most likely to be taken from this report is the total number of individuals without health insurance in 2019, and it's a lot more complicated than just a number. The Census Bureau cites two different numbers from two different surveys in the report, the Current Population Survey 2020 Annual Social and E...

Can Real Estate Supply Keep Up with Hot Demand?

Image
Economic Report Monitor #59 August 14th, 2020 New residential figures for July came out and provided a fresh but of optimism for a strong economic recovery. Housing starts jumped 22.6% in July, another huge bounce, leading to a July total 23.4% higher than last year. The 1.496 million unit starts that beat expectations of 1.24 million heavily.  It was multifamily home units that carried the number in July with a 56.7% increase in that category to 547,000 units. The number is the strongest since January 2020 (619,000 units) and is 67.8% higher than a year ago. Single-family homes were up just 8.2% to 940,000 units, slightly lagging the 1,034,000 units in February. Since single-family homes are typically more in demand, it's slightly concerning to see that category lag the overall trend. Single-family home demand recovery is stronger than supply recovery The NAHB/Wells Fargo Housing Market Index report pointed to hot demand for single-family homes coming out of the bottom of the C...

Consumer Spending Looks Strong Despite Pandemic

Image
Economic Report Monitor #59 August 14th, 2020 Retail sales in July confirmed what most people were expecting. The economic recovery has slowed with a resurgence of COVID-19 cases stalling reopening processes. Overall, sales increased just 1.2% after they surged 8.4% in June and failed to meet expectations of 2.3% that economists surveyed by Dow Jones suggested . Despite growth being muted in July, sales for the first 7 months of 2020 are down just -2.1% from the same period in 2019. Excluding motor vehicles & parts and gasoline stations, that number is actually 0.2% higher. From CNBC Motor vehicles & parts also dragged July retail sales lower with a -1.2% drop for the month. Retail sales without that category were 1.9% and closer to expectations. Building material & garden equipment & supplies dealer also dragged sales with a -2.9% drop itself. Furniture stores were flat at 0.0%. These numbers might point to further pain for durable goods categories which was most inte...

COVID-19 Unemployment Still Elevated but Mostly Temporary

Image
Economic Report Monitor #58 August 7th, 2020 Following the disappointing number on Wednesday, the Bureau of Labor Statistic's official report of the employment situation came out today. In a similar fashion, the BLS report showed a slower recovery in July as only 1.8 million jobs were added with the unemployment rate falling just 0.9% to 10.2%. While this beat expectations of about 1.6 million, it confirmed that a V-shaped recovery in the labor market is unlikely to materialize. From MarketWatch The number of unemployed individuals dropped by just 1.4 million to 16.3 million but is still up by about 10.6 million since February. Most of the COVID-19 losses remain as the number of individuals that have been jobless for 15 to 26 weeks rose by 4.6 million to total 6.5 million. Fresh job losses that occurred in the last 5 weeks are about 3.2 million, with just 364,000 added in July, suggesting the contraction in employment has slowed significantly. Most of the job additions were tempo...

ADP Employment Disappoints, But Small Businesses Notch Jobs Gain

Image
Economic Report Monitor #57 August 5th, 2020 The first of the jobs numbers came out today for July as the ADP Employment Report  was released before the market opened. The number largely disappointed with an increase of 167,000 in private payrolls, well below the June reading of 4.314 million and the expected number for July of 1.5 million. Based on the report, it seems that the resurgence of cases has influenced reopening processes to slow and in some cases stop completely. Larger companies lead the gains adding 129,000 jobs in July with medium businesses shedding -25,000 and small businesses adding 63,000. Small businesses probably only outperformed medium businesses because reopening processes are likely favoring operations with small numbers of employees working at a time. Businesses with only 1-19 employees, typically the most economically sensitive, added 45,000 jobs, the second-most behind businesses with 1,000+ at 111,000. The sectors that added the most jobs were in the s...

Breaking Down the Worst Quarterly GDP Decline in US History

Image
Economic Report Monitor #56 July 30th, 2020 From FRED The long-awaited 2020 Q2 GDP came out today after months of deliberation on how the COVID-19 outbreak and the lockdown would initially impact the economy. Consensus estimates suggested that 2020 Q2 GDP would fall about -34% from the previous quarter in the largest drop in economic output in history. The official advance estimate came in at -32.9% just above expectations but still the worst quarterly GDP data point ever reported. Stocks saw mixed reactions as the Dow (-0.85%) and the S&P 500 (-0.38%) finished lower while the Nasdaq (0.43%) actually saw a gain. The 10-year Treasury yield dropped back to its low near 0.55% as investors continued to move away from risk. Personal consumption, which has been a strong driver of GDP growth in the past, tanked -34.6% in the second quarter with service spending seeing the largest drop at -43.5%. Goods expenditures fared slightly better at -11.3% as the goods economy adjusted to the new C...

Consumer Expectations Sour as Market Turns Lower

Image
Economic Report Monitor #55 July 28th, 2020 Consumer confidence is an important indicator of consumption and overall economic health as the US economy as measured by GDP is heavily driven by consumption. Since the beginning of the COVID-19 pandemic, current measures of consumer confidence in the two main surveys for the indicator, the Conference Board Consumer Confidence Index and the University of Michigan Survey of Consumers, have trended near all-time lows comparable to the 2008 financial crisis. However, readings of expectations typically fared better as the initial evaluation of consumers was that the lockdowns and pandemic would be temporary. Almost 5 months later, those trends have begun to reverse. In today's Conference Board Consumer Confidence Index July  report , the index reported a drop from 98.3 in June to 92.6 in July with a large deterioration in expectations. The current conditions index continued to improve as reopening measures assuaged concerns of financial inst...

Market Drops on More Tepid Economic Data

Image
Economic Report Monitor #54 July 23rd, 2020 As the pandemic continues to add new cases to the overall count, the market continues to struggle with an economic condition that is not improving. In another day of selling off, major indexes fell -1 to -2% with the Nasdaq leading the drop at -2.29%. Safe havens like gold and silver flourish as optimism stales and valuations continue to be tough to justify. The  jobless claims  reports today is just one example of that as initial claims increase for the first time since it seemed to have peaked in April. At 1.416 million, an additional 109,000 claims were added last week as the number of individuals beginning the unemployment process remains above 1 million for another week. Continuing claims did drop though as the insured unemployment rate fell to 11.1% and 1.107 million individuals stop receiving unemployment insurance. States where COVID-19 cases are resurging, Florida, Georgia, and California, are the main culprits for the incre...

Jobless Claims Struggle to Fall Despite Bullish Spending Seen in Retail Sales

Image
Economic Report Monitor #53 July 16th, 2020 The previous choppy bullish trading session was reversed into a choppy bearish trading on Thursday as indexes headed for a loss. The Nasdaq, down -0.73%, underperformed the Dow Jones Industrial Average and the S&P 500 again, down -0.50% and -0.34%. Over the last 5 days, information technology stocks have dropped -2.75%, the most in a list of 11 sectors, with energy leading at 5.57%. This differs greatly from the YTD performance where information technology is up 17.51%, well above the -37.78% movement in energy. It seems money might be avoiding the sectors which have benefited the most in the rebound as a resurgence could crash them harder. Economic reports confirmed the shaky status in a mixed bag of data points. Most notably, initial jobless claims came in above 1 million once again at 1.3 million, just 10,000 lower than the week before. Overall insured unemployment also fell but again only at a slow pace. Totaled continued claims wer...

More Economic Reports Point to a Bottom, but a Recovery Continues to Look Father Off

Image
Economic Report Monitor #52 July 15th, 2020 A choppy day in trading ends with indexes higher about 0.5% to 1.0%. Nasdaq once again lagged the other major indexes as tech stocks look to slow from their fast pace. Treasury yields remain low despite hopes that Moderna's coronavirus vaccine would continue to show positive results. The dollar reaches towards YTD lows. Consolidation looks to be the trend as bad news continues to outweigh the good news, and the recovery pauses as investors look for a reason to buy. The latest Empire State Manufacturing Index for July 2020 suggested manufacturing activity has stabilized in NY. The general business conditions index grew to 17.2 in July marking its first positive reading since February. While the index values have completed a V-shaped recovery, most categories point to just a stabilization. Despite the indexes jumping to near-term highs, only a net 17.4% and 15.2% reported seeing higher new orders and shipments. Unfilled orders were gridloc...

Inflation Is Mostly Flat in June but Battered Indexes Show Signs of Life

Image
Economic Report Monitor #51 July 14th, 2020 The market ripped higher today on continued hope that a vaccine would quell the coronavirus pandemic earlier than expected. The Dow Jones Industrial Average jumped 2.13% with the S&P 500 and Nasdaq up 1.34% and 0.94%. With tech stocks lagging, the market favored the most battered companies beating out stocks that have fared better. In another bid of optimism, the latest CPI report for June 2020 signaled a resurgence in demand after three months of contraction. In June, the CPI's monthly gain was 0.6%, a strong improvement that grew YoY CPI to 0.6%. Food and energy CPI caused most of the gains with the former up 0.6% and the latter up 5.1%. That left the YoY ex-food-and-energy CPI flat at 1.2%. Most notably in the food category the meat index continued its rise, up 4.8% in June and 20.4% in the last 3 months. In fact, all six major grocery store food group indexes rose over the past 12 months as stockpiling pressure continued through ...

Pending Home Sales Posts its Largest Ever Monthly Gain

Image
Economic Report Monitor #50 June 27th, 2020 Another quiet day economic day opens the last week of June trading which has been bearish so far. Indexes ended their rebounds off March bottoms as uncertainty over a resurgence in cases rises to limit hopes that the health crisis would be over quicker than expected. That does not seem to be the case. However, the real estate market looks to have shaken off that disappointment. The National Association of Realtor's (NAR) pending home sales report released  today increased 44.3% in May after two months of declines. This is the highest one month increase in the series history. Despite the steep incline, year-over-year contract activity was still down -5.1%.  The NAR's chief economist Lawrence Yun suggests that the robust rebound in the housing sector "could lead the way for a broader economic recovery." With the strong report, the forecasts for existing-home sales and new home sales for 2020 were increased. The Dallas Fed Man...

Consumption Recovery Slow Despite Massive Increase in Disposable Income

Image
Economic Report Monitor #49 June 26th, 2020 From FxPro The week ends with a look at the report of personal income and outlays in May. On a month over month basis, personal income fell -4.2% after being boosted by stimulus checks in April. Disposable income fell with it, down -4.9%. The increase in cash from the stimulus and partial reopening of the economy allowed consumption to rise 8.2% in May. The largest bump was in durable goods consumption which grew 28.6% while services consumption was up just 5.4% and nondurable goods consumption was up 7.7%. However, inflation remains at lows from April with the general PCE price index at 0.5% and the more closely followed PCE price index (excluding food and energy) at 1.0%. YoY comparisons still put personal consumption down -9.8% despite disposable personal income up 8.2% in the same period. Here, services lag the most, down -14.3% from a year ago. It's clear that consumers' economic well-being is not the culprit for sluggish consum...

Initial Jobless Claims Still Over 1 million as Sluggish Employment Recovery Continues

Image
Economic Report Monitor #48 June 25th, 2020 From The Real Economy Blog Jobless claims take the headlines again as elevated initial claims numbers continue to be reported. Last week 1.48 million initial claims for unemployment were filed, just a 60,000 drop from the week before. Continued claims also remained high, despite states reopening, with a 13.4% insured unemployment rate dropping just 0.5%. That means 19.522 million individuals are still claiming unemployment, just a 767,000 drop. Employment just hasn't recovered as most would hope with businesses still forced to keep costs low on restricted cash flow. There is also the concern that individuals receiving more in benefits than they would in wages might decide to delay their return to the workforce. These are just two factors playing into the sluggish recovery seen in jobless claims. Durable goods new orders data was a bit more optimistic as the May report showed a 15.8% increase in new orders. Transportation equipment, an i...

Uncertainty Remains High for Businesses as COVID-19 Cases Resurge

Image
Economic Report Monitor #47 June 24th, 2020 On a mostly quiet day of economic indicator reporting, the stock market fell in response to an increase in COVID-19 effects in certain states. A resurgence in cases has injected new uncertainty into the economic outlook as the reopening process looks to be ineffective in staving off further infections. The hardest-hit states, Florida and Texas, have yet to see major strains on their respective healthcare systems, but if the situation isn't addressed, that the strain could return.  Businesses reflected this increase in uncertainty in the June update of the Atlanta Fed's Survey of Business Uncertainty. The headline Business Uncertainty Index rose to 311.8 in June from 285.7 in May as respondents reported not knowing how sales, employment, and capital expenditures will look in the next 12 months. Uncertainty over sales growth continues to be a major concern for firms as it rises 397.3 to 440.0. If businesses can't be sure that reven...

First June PMI Signals a V-shape Rebound

Image
Economic Report Monitor #46 June 23rd, 2020 The first look of June manufacturing data was released today as IHS Markit reported its  IHS Markit Flash U.S. Composite PMI . In true V-shaped fashion, the composite index shot up to 46.8, up from 37.0 in May and about 27 in April. The service and manufacturing index were equally as strong as both bounced from high 30's to high 40's as demand returned with the reopening of the economy in early June. However, some businesses noted that "renewals and requests for new business were historically muted." Employment contractions slowed as well as furloughed staff returned, but many businesses were still forced to cut labor costs. A recovering cost of business was also visible in rising prices paid and received by businesses as deflationary effects eased. Still, IHS suggests any economic expansion "will be prone to losing momentum due to persistent weak demand for many goods and services." It would not be entirely surpri...

High Yield Downgrades, Default Rates Near Financial Crisis Level

Image
Economic Report Monitor #45 June 22nd, 2020 The week starts quietly with just two major economic reports headlining on Monday. The Chicago Fed National Activity Index  bounced back in May up to 2.61 after a steep drop to -17.89 in April. The rebound came on the back of a huge May jobs report where payrolls rose by over 2.5 million after the steep 20 million-plus drop in April. There was, of course, a footnote to the massive jobs gains as the Bureau of Labor Statistics admitted the job addition might have been inflated, so aggregate economic indicators like this and the Conference Board indexes may be inflated because of this. The CFNAI also saw an 0.89 bump from production indicators, an increase that could've been larger if industrial production didn't disappoint at up just 1.4%. Sales, orders, and inventories indicators contributed just 0.02 and personal consumption and housing indicators just 0.17. The latter category struggling as strong real estate is offset by weak person...

Employment Data Lags While Rebound Continues

Image
Economic Report Monitor #44 June 18th, 2020 Here we go again. Another jobless claims number breaks a million as 1.508 million initial unemployment claims were filed last week, down just 58,000 from the week before. In addition to another high initial claims number, continuing claims fell just 62,000, maintaining its level above twenty million at 20.544 million or 14.1%. Both trends contradict the surprise May jobs report and suggest the rebound seen in other areas of the economy has not been replicated in the labor market. In fact, the federal version of the Pandemic Unemployment Assistance program saw claims increase 66,063 in the week of June 13th after a fall of over 100,000 in the previous week. The momentum in the jobless claims report differed from the Philadelphia Fed Manufacturing Survey which saw its headline business activity data jump 70.6 points to 27.5. The readings for new orders and shipments saw similar increases as both rose sharply out into positive territory. While...

Real Estate Demand Rebounds, but Is Housing Supply Lagging?

Image
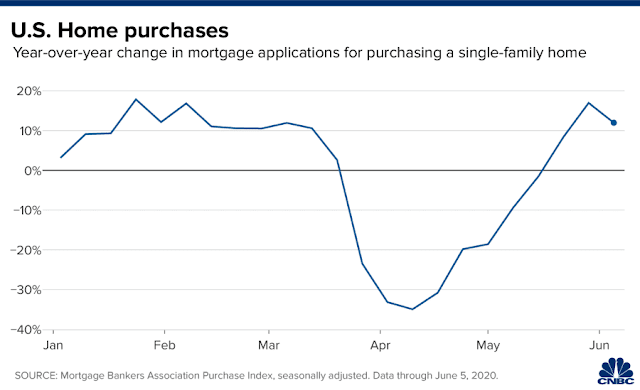
Economic Report Monitor #43 June 17th, 2020 A relatively quiet day in the market, the S&P 500 bouncing from gains to a -0.36% loss, saw just a few economic reports. Most of them continued to frame the real estate market that continues to signal its strength. MBA Mortgage Application index continued its rampage upwards as the composite index grew 8.0% with both purchasing and refinancing indexes rising 4.0% and 10.0%. Low-interest rates have certainly had an impact on the movement of this data point, but the consistent strength seen weekly likely points towards a resurgence in demand viable at cheaper borrowing prices. Single-family home demand has already seemingly recovered to pre-COVID-19 levels according to a CNBC chart . Housing start data was also released as a set of indicators posted mixed results. Housing starts lagged the most up just 4.3% as single-family home starts stalled at 0.1%. Year-over-year the indicator is still off -23.2%. Housing authorizations and building pe...